To better meet the needs for University reporting, the departments of Institutional Research and Effectiveness (IRE) and Information Technologies (IT) have been working with data stewards around campus to transition critical reports and data sources from Cognos to Tableau as part of the University’s Central Analytic Platform.
Accessing the Central Analytic Platform
Requesting Access
User Licenses
Roles
Navigating to Reports/Workbooks
Navigating to Specific Workbooks/Dashboards
Viewing and Interacting with Dashboards
Additional Resources
UD’s Central Analytic platform (VGER) runs using the Tableau server. It can be accessed at https://vger.udel.edu/
You can log in using your UD Central Authentication Service (CAS) credentials.
Note: Users accessing VGER off-campus will need to connect through UD’s Virtual Private Network (VPN) first.
Access is granted to dashboards at the project level and approved by data stewards. To request access to VGER, use this link: https://services.udel.edu/TDClient/32/Portal/Requests/ServiceDet?ID=143
IRE licenses Tableau on a per user basis. Only one license is needed per person. Individuals are also granted roles in the platform to ensure they have access only to the data they need to perform their job responsibilities.
The licenses available are:
-
Viewer: View and interact with dashboards.
-
Explorer: View, interact, create, and edit dashboards; explore data using Ask Data and Tableau workbooks.
-
Creator: Author and publish new dashboards; create new data sources using the desktop tool. All Explorer capabilities are included as well.
A user’s ability to view, edit, and interact with content is defined by their role in a specific project. The project roles are as follows:
-
Interactor: View and interact with Tableau Dashboards; download aggregated data; cannot download raw data. *Most common
-
Editor: Edit the Dashboard; view and download raw data; limited to developers and data stewards and is based on entitlements in source systems.
-
Analyst: View, interact with, download, and “publish as” dashboard permissions; view and download raw data; cannot overwrite dashboard; limited to analysts and is based on entitlements in source systems.
-
Project Leader: Includes all capabilities of Editor, and the ability to maintain/delete dashboards in the project; limited to platform administrators.
-
Connector: Applies to Data Sources Only - allows a user with an Explorer or Creator license (see above) to connect to and use a data source. This user will be able to see all row level details in the data source. Limited to developers and data stewards and is based on entitlements in source systems.
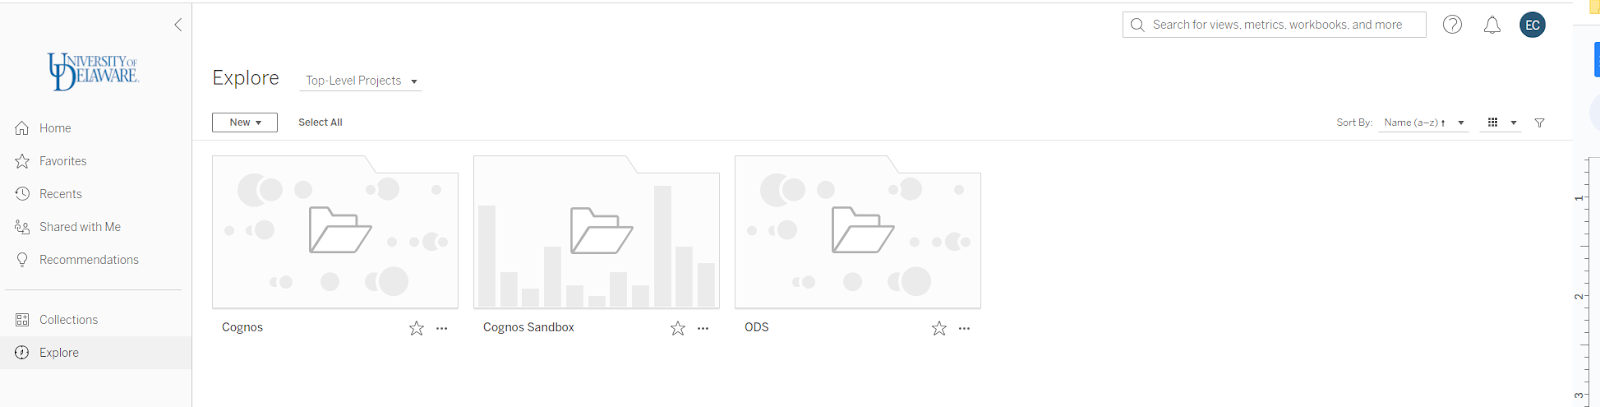
Once you are signed into VGER (Tableau), you will see the "Explore" screen which, by default, lists all the projects you have been added to. You can sort the projects on this page by selecting the drop-down menu next to “Sort By” on the right side of this screen.
You can select an individual project by double-clicking on it, and then navigating to any workbook located in that project.
To navigate to All Workbooks or All Views, select "Top-Level Projects" next to Explore and choose the option from the dropdown menu.
Note: Users with Explorer or Creator licenses are able to select “New” and create a new Project, Workbook, or Flow.
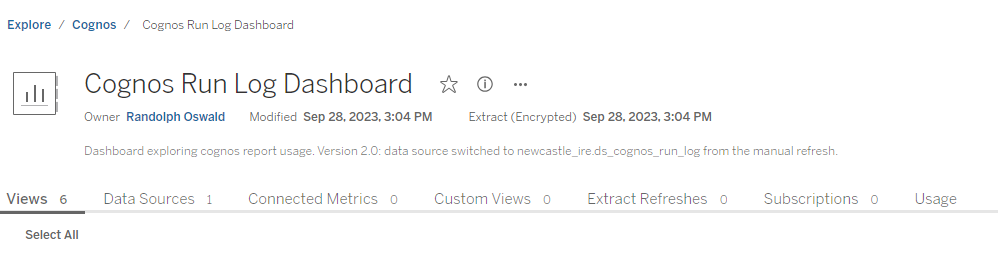
Once you have selected an individual workbook inside a project, you can see metadata available, including the name of the workbook, its owner, last modified date, and a short description.
Created or custom views, associated data sources, any connected metrics, extract refreshes, subscriptions, and usage history are also available from the workbook. Select a View to look at an individual dashboard which contains data from the workbook.
As a Viewer, you have the ability to view and interact with published visualizations and dashboards. You can apply filters and download the dashboard as an image, datasheet, crosstab, PDF, or PowerPoint file. You can also subscribe to dashboards for regular updates.
Getting Started with Tableau
Extensive help, tutorials and other free resources can be found on Tableau’s website.
IRE has curated a list of recommended training that is available on their site: https://docs.ire.udel.edu/docs/tableau/
IRE has also curated a Salesforce Trailmix of modules and videos for beginners to Tableau. You will need to set up an account with Salesforces’s Trailhead (separate from your UD credentials) to access the training. https://trailhead.salesforce.com/users/jabbruzzesi/trailmixes/getting-started-with-tableau-vger-at-ud
On Campus Support:
UD-hosted Zoom meetings:
IRE hosts bi-weekly meetings on Thursdays of the VGER Users Group, where current members can join Cognos-specific breakout sessions. Questions pertaining to report editors and authors are addressed in these sessions.
Contact information
You can contact the IRE team using this TDX form, or reach out via the Microsoft Teams chat: Teams-University Reporting (fka Cognos).